| TBDP© Rate-of-Change Performance Analysis | (click on screen to return) | |
| BREAKTHROUGH! (for tunnel hulls and vee hulls) | ||
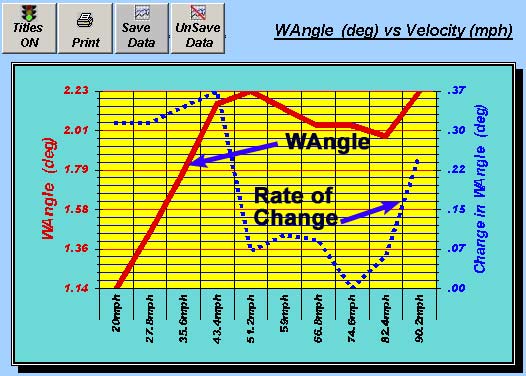 Figure 1- TBDP®/TBDP® graphic output shows (35) performance measures as function of velocity, through the full operating velocity range. The charting feature also shows the Rate-of-Change of the performance measure, for key data measures.. |
We have developed a new analysis tool in the TBDP®/VBDP® software! An easy way to analyze just how “dramatic” the changes in a performance result is to plot a graph of the derivative of the performance data…this is the “rate-of-change” of the data. This is shown on the TBDP© graphic displays for some of the performance data curves. Rate-of-Change data curves are shown automatically for XCGStatic, WAngle, XCGDynamic, Xpress, and DelStab performance data presentation graphs. The performance data curve is shown on the graph as the red line (as a function of each velocity step through the velocity range. The “rate-of-change” data is shown on the TBDP© graphic displays as the blue line on the graph (see above). The “rate-of-change” curve shows the ABSOLUTE VALUE of the change of the performance data measure…that is, it shows the CHANGE, when it is positive or negative. |
|
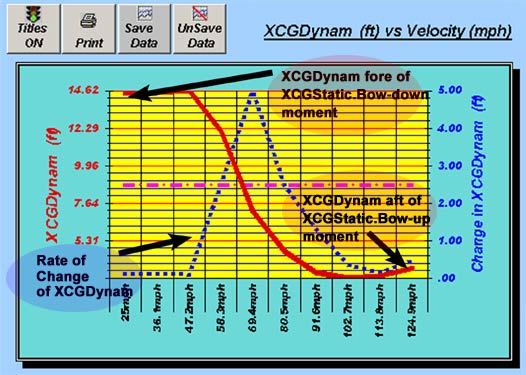 Figure 2 - TBDP®/TBDP® graphic output shows key "Dynamic Stability" performance, and now shows critical "Rate-of-change" for XCGDynamic, signalling the onset of hull instability. |
When the “rate-of-change” curve is decreasing,. This means that the performance data measure (e.g.: XCGDynamic) is changing at a slower rate. When the “rate-of-change” curve is increasing, this means that the performance data measure is changing at a faster rate. (In the case of a hull stability performance measure, such as XCGDynamic, this can indicate that the hull is becoming more unstable and may be more difficult for the driver to correct). With key performance indicators such as "Dynamic Stability" (red line), we can determine when the shifting XCGDynamic is signaling the onset of instability. An easy way to analyze just how “dramatic” the changes in shifting XCGDynamic is to plot a graph of the derivative of the XCGDynamic data…this is the “rate-of-change” of XCGDynamic…and is shown on the TBDP© graphic displays (blue line) on the chart. When this curve is increasing, this means that XCGDynamic is changing at a faster rate. This can indicate that the hull is becoming more unstable and may be more difficult for the driver to correct. |
|
|
TBDP®/VBDP® makes it easy to analyze the performance and stability improvements that are achieved by design modifications and/or setup changes - and improvements to hull design and performance! |
||